Chapter 1: Down the rabbit hole
To start this journey I'll cover some backstory on the Flutter stack and how it works.
What you probably already know: Flutter was built from the ground up with its own render pipeline and widget library, allowing it to be truly cross platform and have a consistent design and feel no matter what device its running on.
Unlike most platforms, all of the essential rendering components of the flutter framework (including animation, layout, and painting) are fully exposed to you in package:flutter.
You can see these components in the official architecture diagram from wiki/The-Engine-architecture:
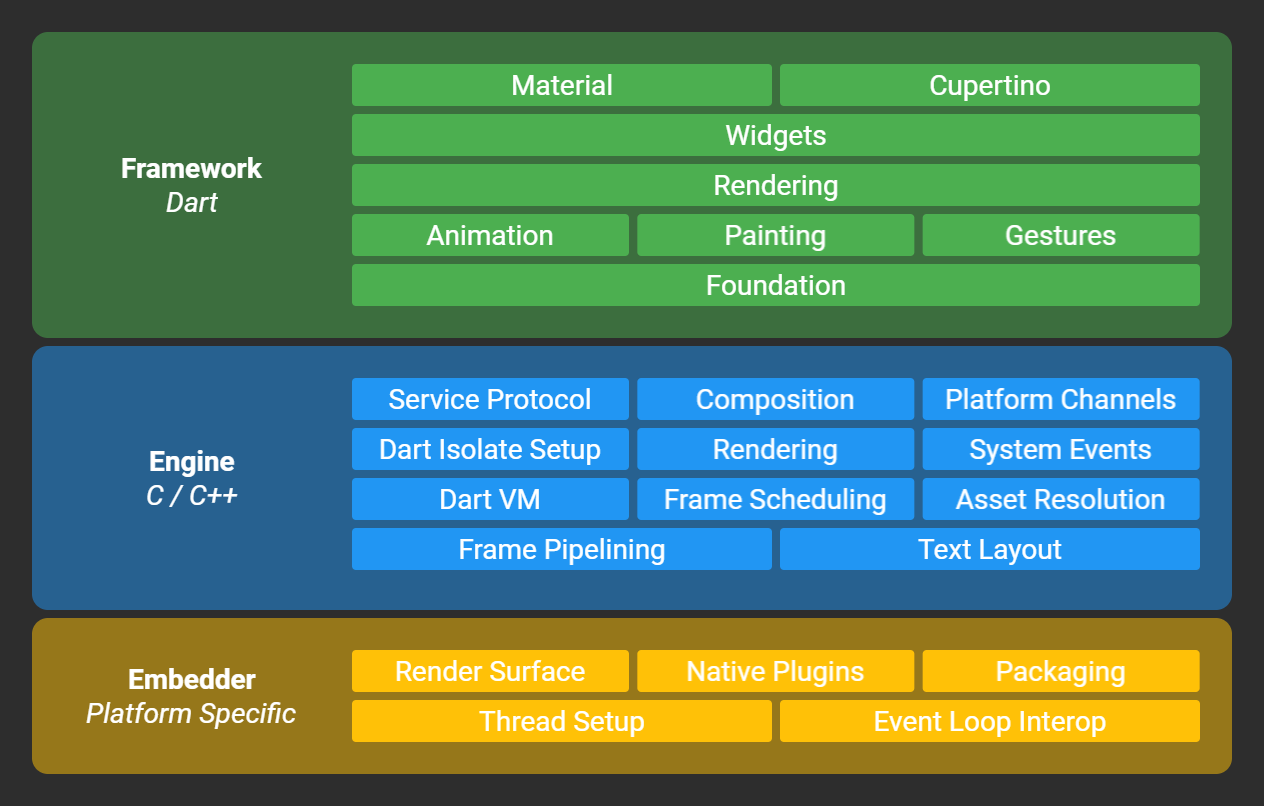
From a reverse engineering perspective the most interesting part is is the Dart layer since that is where all of the app logic sits.
But what does the Dart layer look like?
Flutter compiles your Dart to native assembly code and uses formats that have not been publicly documented in-depth let alone fully decompiled and recompiled.
For comparison other platforms like React Native just bundle minified javascript which is trivial to inspect and modify, additionally the bytecode for Java on Android is well documented and there are many free decompilers for it.
Despite the lack of obfuscation (by default) or encryption, Flutter apps are still extremely difficult to reverse engineer at the moment since it requires in-depth knowledge of Dart internals to even scratch the surface.
This makes Flutter very good from an intellectual property perspective, your code is almost safe from prying eyes.
Next I'll show you the build process of Flutter applications and explain in detail how to reverse engineer the code that it produces.
Snapshots
The Dart SDK is highly versatile, you can embed Dart code in many different configurations on many different platforms.
The simplest way to run Dart is to use the dart executable which just reads dart source files directly like a scripting language. It includes the primary components we call the front-end (parses Dart code), runtime (provides the environment for code to run in), and the JIT compiler.
You can also use dart to create and execute snapshots, a pre-compiled form of Dart which is commonly used to speed up frequently used command line tools (like pub).
#lint shell
ping@debian:~/Desktop$ time dart hello.dart
Hello, World!

real    0m0.656s
user    0m0.920s
sys     0m0.084s

ping@debian:~/Desktop$ dart --snapshot=hello.snapshot hello.dart
ping@debian:~/Desktop$ time dart hello.snapshot
Hello, World!

real    0m0.105s
user    0m0.208s
sys     0m0.016s
As you can see, the start-up time is significantly lower when you use snapshots.
The default snapshot format is kernel, an intermediate representation of Dart code equivalent to the AST.
When running a Flutter app in debug mode, the flutter tool creates a kernel snapshot and runs it in your android app with the debug runtime + JIT. This gives you the ability to debug your app and modify code live at runtime with hot reload.
Unfortunately for us, using your own JIT compiler is frowned upon in the mobile industry due to increased concerns of RCEs. iOS actually prevents you from executing dynamically generated code like this entirely.
There are two more types of snapshots though, app-jit and app-aot, these contain compiled machine code that can be initialized quicker than kernel snapshots but aren't cross-platform.
The final type of snapshot, app-aot, contains only machine code and no kernel. These snapshots are generated using the gen_snapshots tool found in flutter/bin/cache/artifacts/engine/<arch>/<target>/, more on that later.
They are a little more than just a compiled version of Dart code though, in fact they are a full "snapshot" of the VMs heap just before main is called. This is a unique feature of Dart and one of the reasons it initializes so quickly compared to other runtimes.
Flutter uses these AOT snapshots for release builds, you can see the files that contain them in the file tree for an Android APK built with flutter build apk:
#lint shell
ping@debian:~/Desktop/app/lib$ tree .
.
├── arm64-v8a
│   ├── libapp.so
│   └── libflutter.so
└── armeabi-v7a
    ├── libapp.so
    └── libflutter.so
Here you can see the two libapp.so files which are a64 and a32 snapshots as ELF binaries.
The fact that gen_snapshots outputs an ELF / shared object here might be a bit misleading, it does not expose dart methods as symbols that can be called externally. Instead, these files are containers for the "clustered snapshot" format but with compiled code in the separate executable section, here is how they are structured:
#lint shell
ping@debian:~/Desktop/app/lib/arm64-v8a$ aarch64-linux-gnu-objdump -T libapp.so

libapp.so:     file format elf64-littleaarch64

DYNAMIC SYMBOL TABLE:
0000000000001000 g    DF .text  0000000000004ba0 _kDartVmSnapshotInstructions
0000000000006000 g    DF .text  00000000002d0de0 _kDartIsolateSnapshotInstructions
00000000002d7000 g    DO .rodata        0000000000007f10 _kDartVmSnapshotData
00000000002df000 g    DO .rodata        000000000021ad10 _kDartIsolateSnapshotData
The reason why AOT snapshots are in shared object form instead of a regular snapshot file is because machine code generated by gen_snapshot needs to be loaded into executable memory when the app starts and the nicest way to do that is through an ELF file.
With this shared object, everything in the .text section will be loaded into executable memory by the linker allowing the Dart runtime to call into it at any time.
You may have noticed there are two snapshots: the VM snapshot and the Isolate snapshot.
DartVM has a second isolate that does background tasks called the vm isolate, it is required for app-aot snapshots since the runtime can't dynamically load it in as the dart executable would.
The Dart SDK
Thankfully Dart is completely open source so we don't have to fly blind when reverse engineering the snapshot format.
Before creating a testbed for generating and disassembling snapshots you have to set up the Dart SDK, there is documentation on how to build it here: https://github.com/dart-lang/sdk/wiki/Building.
You want to generate libapp.so files typically orchestrated by the flutter tool, but there doesn't seem to be any documentation on how to do that yourself.
The flutter sdk ships binaries for gen_snapshot which is not part of the standard create_sdk build target you usually use when building dart.
It does exist as a separate target in the SDK though, you can build the gen_snapshot tool for arm with this command:
./tools/build.py -m product -a simarm gen_snapshotNormally you can only generate snapshots for the architecture you are running on, to work around that they have created sim targets which simulate snapshot generation for the target platform. This has some limitations such as not being able to make aarch64 or x86_64 snapshots on a 32 bit system.
Before making a shared object you have to compile a dill file using the front-end:
~/flutter/bin/cache/dart-sdk/bin/dart ~/flutter/bin/cache/artifacts/engine/linux-x64/frontend_server.dart.snapshot --sdk-root ~/flutter/bin/cache/artifacts/engine/common/flutter_patched_sdk_product/ --strong --target=flutter --aot --tfa -Ddart.vm.product=true --packages .packages --output-dill app.dill package:foo/main.dartDill files are actually the same format as kernel snapshots, their format is specified here: https://github.com/dart-lang/sdk/blob/master/pkg/kernel/binary.md
This is the format used as a common representation of dart code between tools, including gen_snapshot and analyzer.
With the app.dill we can finally generate a libapp.so using this command:
gen_snapshot --causal_async_stacks --deterministic --snapshot_kind=app-aot-elf --elf=libapp.so --strip app.dillOnce you are able to manually generate the libapp.so, it is easy to modify the SDK to print out all of the debug information needed to reverse engineer the AOT snapshot format.
As a side note, Dart was actually designed by some of the people who created JavaScript's V8 which is arguably the most advanced interpreter ever made. DartVM is incredibly well engineered and I don't think people give its creators enough credit.
Anatomy of a snapshot
The AOT snapshot itself is quite complex, it is a custom binary format with no documentation. You may be forced to step through the serialization process manually in a debugger to implement a tool that can read the format.
The source files relevant to snapshot generation can be found here:
- Cluster serialization / deserialization
vm/clustered_snapshot.hvm/clustered_snapshot.cc - ROData serialization
vm/image_snapshot.hvm/image_snapshot.cc - ReadStream / WriteStream
vm/datastream.h - Object definitions
vm/object.h - ClassId enum
vm/class_id.h
It took me about two weeks to implement a command line utility that is capable of parsing a snapshot, giving us complete access to the heap of a compiled app.
As an overview, here is the layout of clustered snapshot data:
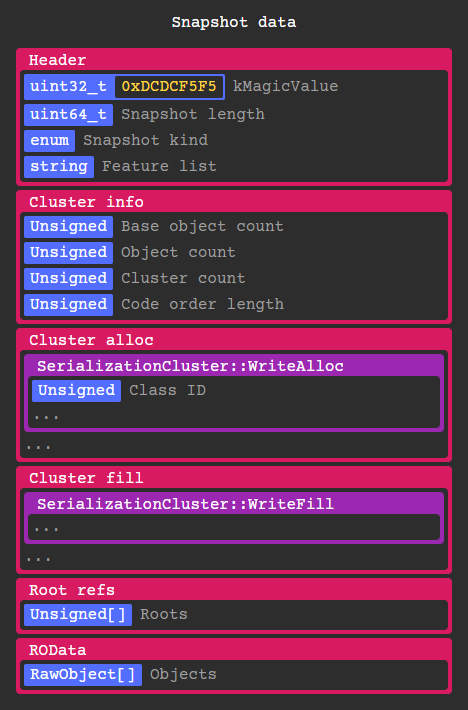
Every RawObject* in the Isolate gets serialized by a corresponding SerializationCluster instance depending on its class id. These objects can contain anything from code, instances, types, primitives, closures, constants, etc. More on that later.
After deserializing the VM isolate snapshot, every object in its heap gets added to the Isolate snapshot object pool allowing them to be referenced in the same context.
Clusters are serialized in three stages: Trace, Alloc, and Fill.
In the trace stage, root objects are added to a queue along with the objects they reference in a breadth first search. At the same time a SerializationCluster instance is created corresponding to each class type.
Root objects are a static set of objects used by the vm in the isolate's ObjectStore which we will use later to locate libraries and classes. The VM snapshot includes StubCode base objects which are shared between all isolates.
Stubs are basically hand written sections of assembly that dart code calls into, allowing it to communicate safely with the runtime.
After tracing, cluster info is written containing basic information about the clusters, most importantly the number of objects to allocate.
In the alloc stage, each clusters WriteAlloc method is called which writes any information needed to allocate raw objects. Most of the time all this method does is write the class id and number of objects that are part of this cluster.
The objects that are part of each cluster are also assigned an incrementing object id in the order they are allocated, this is used later during the fill stage when resolving object references.
You may have noticed the lack of any indexing and cluster size information, the entire snapshot has to be read fully in order to get any meaningful data out of it. So to actually do any reverse engineering you must either implement deserialization routines for 31+ cluster types (which I have done) or extract information by loading it into a modified runtime (which is difficult to do cross-architecture).
Here is a simplified example of what the structure of the clusters would be for an array [123, 42]:
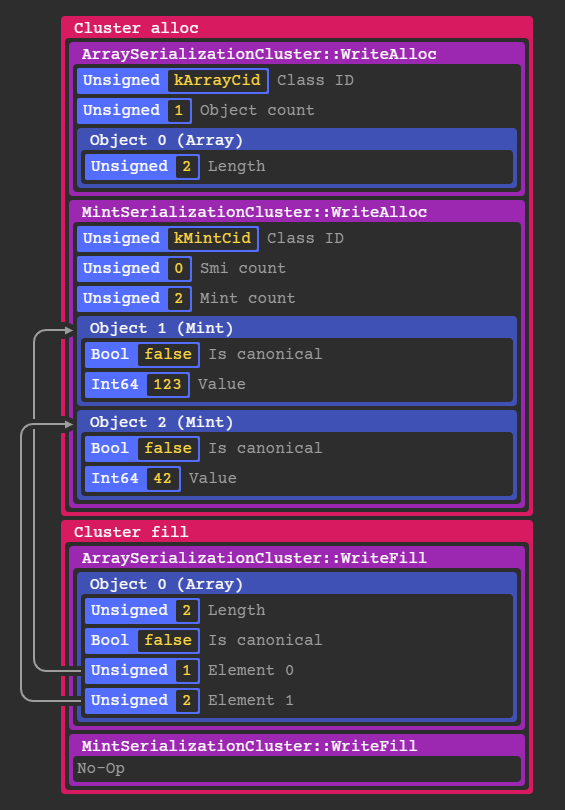
If an object references another object like an array element, the serializer writes the object id initially assigned during the alloc phase as shown above.
In the case of simple objects like Mints and Smis, they are constructed entirely in the alloc stage because they don't reference any other objects.
After that the ~107 root refs are written including object ids for core types, libraries, classes, caches, static exceptions and several other miscellaneous objects.
Finally, ROData objects are written which are directly mapped to RawObject*s in-memory to avoid an extra deserialization step.
The most important type of ROData is RawOneByteString which is used for library / class / function names. ROData is also referenced by offset being the only place in the snapshot data where decoding is optional.
Similar to ROData, RawInstruction objects are direct pointers to snapshot data but are stored in the executable instruction symbol rather than main snapshot data.
Here is a dump of serialization clusters that are typically written when compiling an app:
#lint cluster-tbl
idx | cid | ClassId enum        | Cluster name
----|-----|---------------------|----------------------------------------
  0 |   5 | Class               | ClassSerializationCluster
  1 |   6 | PatchClass          | PatchClassSerializationCluster
  2 |   7 | Function            | FunctionSerializationCluster
  3 |   8 | ClosureData         | ClosureDataSerializationCluster
  4 |   9 | SignatureData       | SignatureDataSerializationCluster
  5 |  12 | Field               | FieldSerializationCluster
  6 |  13 | Script              | ScriptSerializationCluster
  7 |  14 | Library             | LibrarySerializationCluster
  8 |  17 | Code                | CodeSerializationCluster
  9 |  20 | ObjectPool          | ObjectPoolSerializationCluster
 10 |  21 | PcDescriptors       | RODataSerializationCluster
 11 |  22 | CodeSourceMap       | RODataSerializationCluster
 12 |  23 | StackMap            | RODataSerializationCluster
 13 |  25 | ExceptionHandlers   | ExceptionHandlersSerializationCluster
 14 |  29 | UnlinkedCall        | UnlinkedCallSerializationCluster
 15 |  31 | MegamorphicCache    | MegamorphicCacheSerializationCluster
 16 |  32 | SubtypeTestCache    | SubtypeTestCacheSerializationCluster
 17 |  36 | UnhandledException  | UnhandledExceptionSerializationCluster
 18 |  40 | TypeArguments       | TypeArgumentsSerializationCluster
 19 |  42 | Type                | TypeSerializationCluster
 20 |  43 | TypeRef             | TypeRefSerializationCluster
 21 |  44 | TypeParameter       | TypeParameterSerializationCluster
 22 |  45 | Closure             | ClosureSerializationCluster
 23 |  49 | Mint                | MintSerializationCluster
 24 |  50 | Double              | DoubleSerializationCluster
 25 |  52 | GrowableObjectArray | GrowableObjectArraySerializationCluster
 26 |  65 | StackTrace          | StackTraceSerializationCluster
 27 |  72 | Array               | ArraySerializationCluster
 28 |  73 | ImmutableArray      | ArraySerializationCluster
 29 |  75 | OneByteString       | RODataSerializationCluster
 30 |  95 | TypedDataInt8Array  | TypedDataSerializationCluster
 31 | 143 | <instance>          | InstanceSerializationCluster
...
 54 | 463 | <instance>          | InstanceSerializationCluster
There are a few more clusters that could potentially be in a snapshot, but these are the only ones I have seen in a Flutter app so far.
In DartVM there are a static set of predefined class IDs defined in the ClassId enum, 142 IDs as of Dart 2.4.0 to be exact. IDs outside of that (or do not have an associated cluster) are written with separate InstanceSerializationClusters.
Finally bringing the parser together I can view the structure of the snapshot from the ground up, starting with the libraries list in the root object table.
Using the object tree here's how you can locate a top level function, in this case package:ftest/main.darts main:
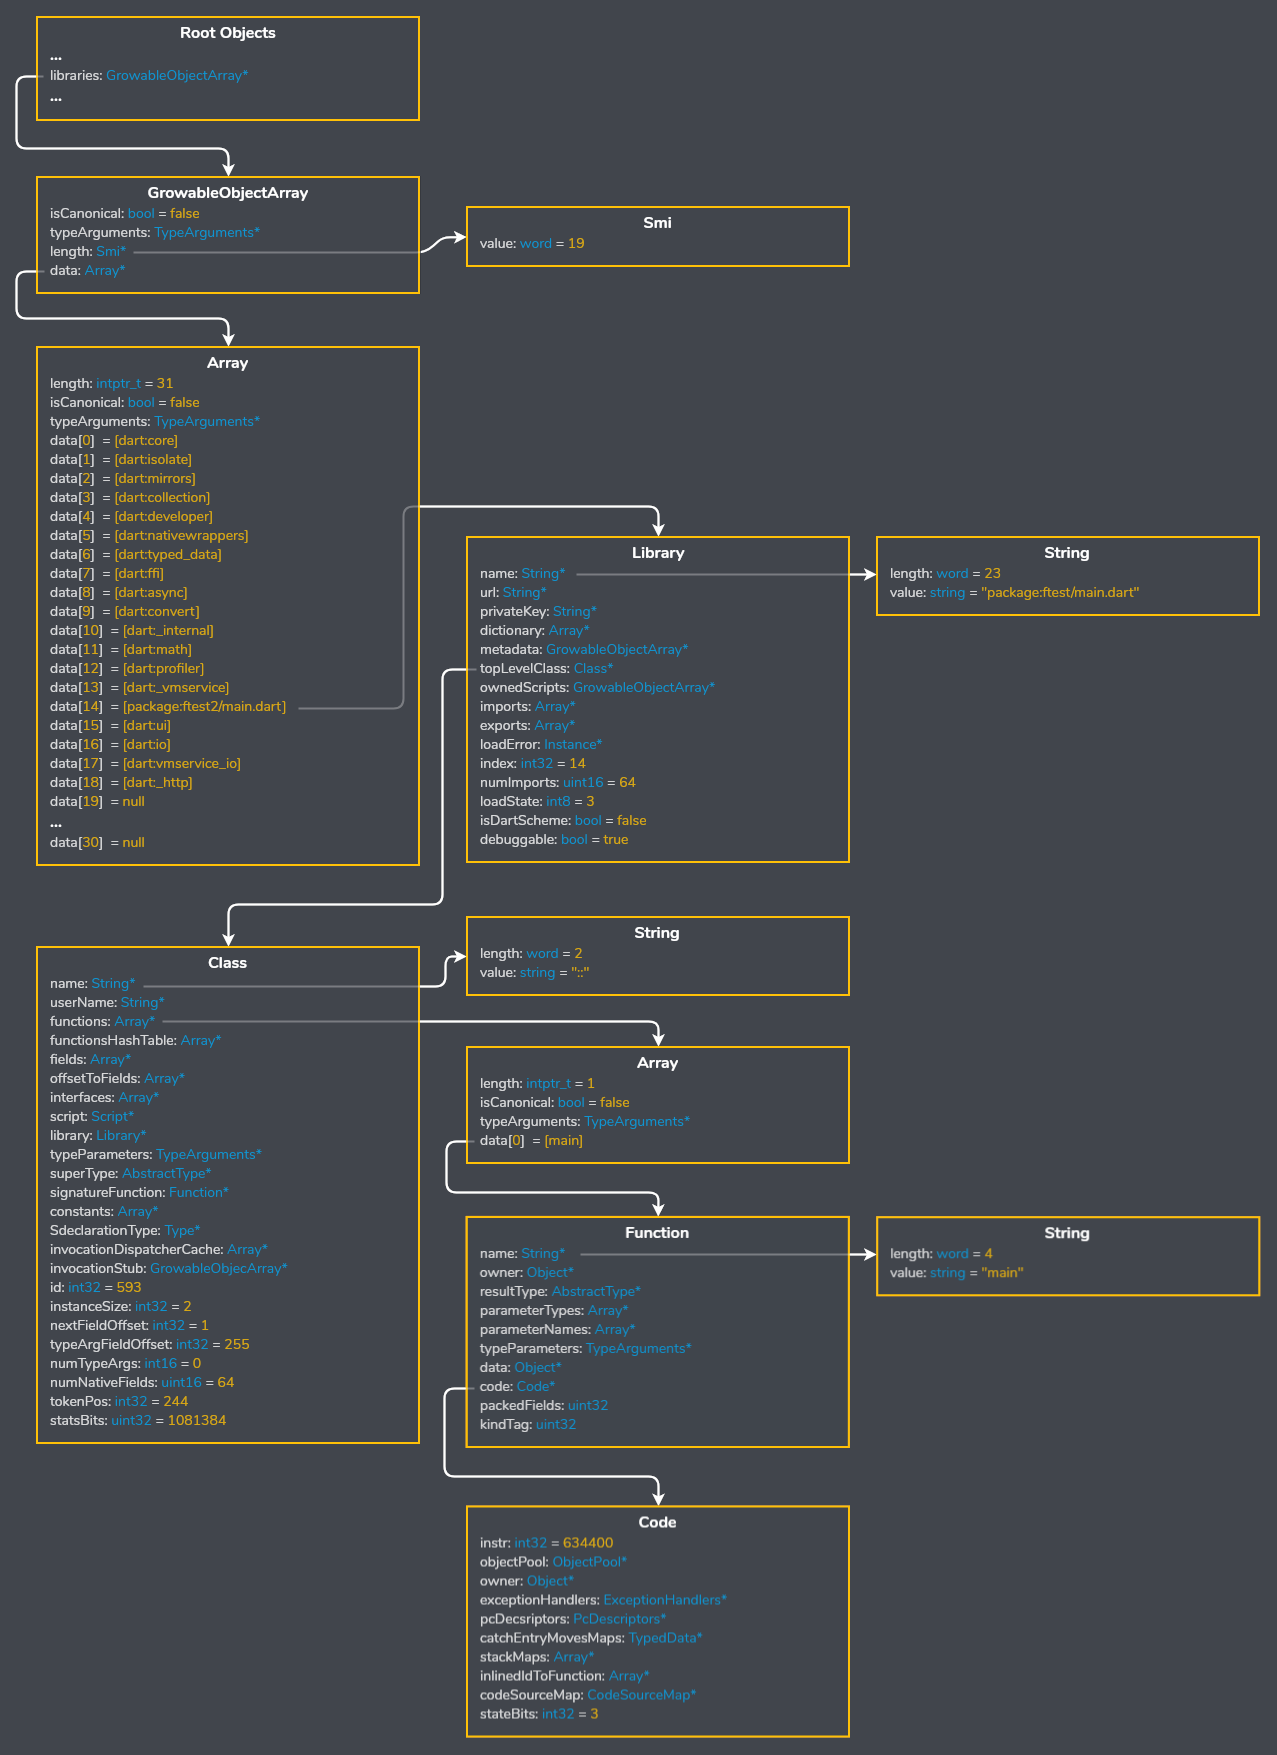
As you can see above the names of libraries, classes, and functions are included in release snapshots.
Dart can't really remove them without also obfuscating stack traces, see: https://github.com/flutter/flutter/wiki/Obfuscating-Dart-Code
Obfuscation is probably not worth the effort but this will most likely change in the future and become more streamlined similar to proguard on Android or sourcemaps on the web.
The actual machine code is stored in Instructions objects pointed to by Code objects from an offset to the start of the instruction data.
RawObject
Under the hood all managed objects in DartVM are called RawObjects, in true DartVM fashion these classes are all defined in a single 3,000 line file found at vm/raw_object.h.
In generated code you can access and move around RawObject*s however you want as long as you yield according to an incremental write barrier mask, the GC appears to be able to track references through passive scanning alone.
Here is the class tree:
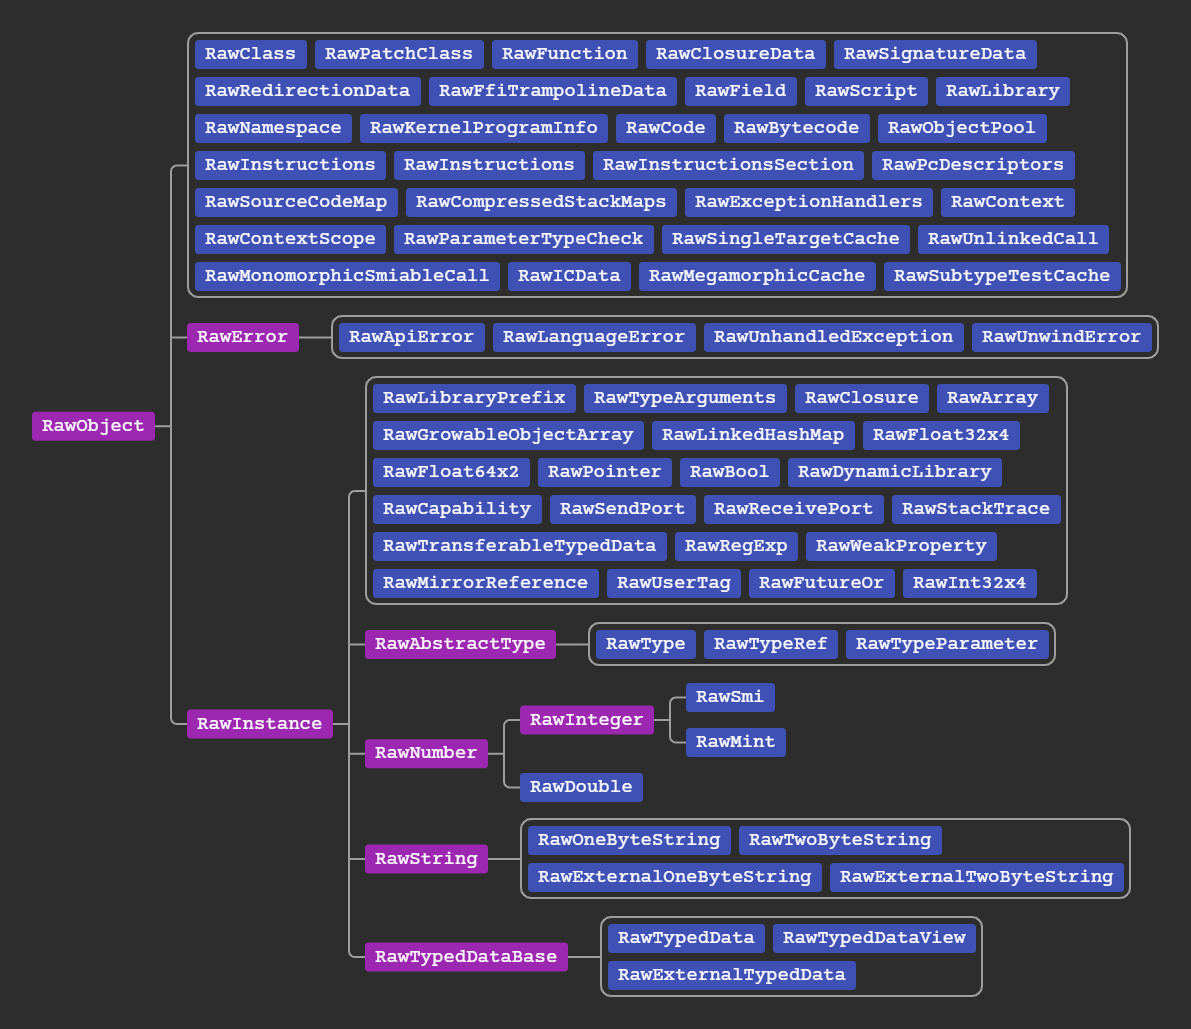
RawInstances are the traditional Objects you pass around Dart code and invoke methods on, all of them have an equivalent type in dart land. Non-instance objects however are internal and only exist to leverage reference tracking and garbage collection, they do not have equivalent dart types.
Each object starts with a uint32_t containing the following tags:
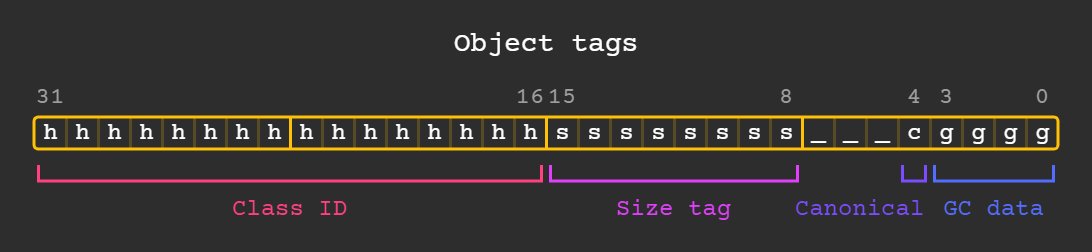
Class IDs here are the same as before with cluster serialization, they are defined in vm/class_id.h but also include user-defined starting at kNumPredefinedCids.
Size and GC data tags are used for garbage collection, most of the time they can be ignored.
If the canonical bit is set that means that this object is unique and no other object is equal to it, like with Symbols and Types.
Objects are very light and the size of RawInstance is usually only 4 bytes, they surprisingly do not use virtual methods at all either.
All of this means allocating an object and filling in its fields can be done virtually for free, something we do quite lot in Flutter.
Hello, World!
Cool, we can locate functions by name but how do we figure out what they actually do?
As expected reverse engineering from here on is a bit more difficult because we are digging through the assembly code contained in Instructions objects.
Instead of using a modern compiler backend like clang, Dart actually uses its JIT compiler for code generation but with a couple AOT specific optimizations.
If you have never worked with JIT code, it is a bit bloated in some places compared to what the equivalent C code would produce. Not that Dart is doing a bad job though, it's designed to be generated quickly at runtime and the hand-written assembly for common instructions often beats clang/gcc in terms of performance.
Generated code being less micro-optimized actually works heavily to our advantage since it closer resembles the higher level IR used to generate it.
Most of the relevant code generation can be found in:
vm/compiler/backend/il_<arch>.ccvm/compiler/assembler/assembler_<arch>.ccvm/compiler/asm_intrinsifier_<arch>.ccvm/compiler/graph_intrinsifier_<arch>.cc
Here is the register layout and calling conventions for dart's A64 assembler:
#lint reg-tbl
       r0 |     | Returns
r0  -  r7 |     | Arguments
r0  - r14 |     | General purpose
      r15 | sp  | Dart stack pointer
      r16 | ip0 | Scratch register
      r17 | ip1 | Scratch register
      r18 |     | Platform register
r19 - r25 |     | General purpose
r19 - r28 |     | Callee saved registers
      r26 | thr | Current thread
      r27 | pp  | Object pool
      r28 | brm | Barrier mask
      r29 | fp  | Frame pointer
      r30 | lr  | Link register
      r31 | zr  | Zero / CSP
This ABI follows the standard AArch64 calling conventions here but with a few global registers:
- R26 / THR: Pointer to the running vm
Thread, see vm/thread.h - R27 / PP: Pointer to the
ObjectPoolof the current context, see vm/object.h - R28 / BRM: The barrier mask, used for incremental garbage collection
Similarly, this is the register layout for A32:
#lint reg-tbl
r0 -  r1 |     | Returns
r0 -  r9 |     | General purpose
r4 - r10 |     | Callee saved registers
      r5 | pp  | Object pool
     r10 | thr | Current thread
     r11 | fp  | Frame pointer
     r12 | ip  | Scratch register
     r13 | sp  | Stack pointer
     r14 | lr  | Link register
     r15 | pc  | Program counter
While A64 is a more common target I'll mostly be covering A32 since its is simpler to read and disassemble.
You can view the IR along with the disassembly by passing --disassemble-optimized to gen_snapshot, but note this only works on the debug/release targets and not product.
As an example, when compiling hello world:
void hello() {
  print("Hello, World!");
}
Scrolling down a bit in the disassembly you will find:
#lint dartvm-dasm
Code for optimized function 'package:dectest/hello_world.dart_::_hello' {
        ;; B0
        ;; B1
        ;; Enter frame
0xf69ace60    e92d4800               stmdb sp!, {fp, lr}
0xf69ace64    e28db000               add fp, sp, #0
        ;; CheckStackOverflow:8(stack=0, loop=0)
0xf69ace68    e59ac024               ldr ip, [thr, #+36]
0xf69ace6c    e15d000c               cmp sp, ip
0xf69ace70    9bfffffe               blls +0 ; 0xf69ace70
        ;; PushArgument(v3)
0xf69ace74    e285ca01               add ip, pp, #4096
0xf69ace78    e59ccfa7               ldr ip, [ip, #+4007]
0xf69ace7c    e52dc004               str ip, [sp, #-4]!
        ;; StaticCall:12( print<0> v3)
0xf69ace80    ebfffffe               bl +0 ; 0xf69ace80
0xf69ace84    e28dd004               add sp, sp, #4
        ;; ParallelMove r0 <- C
0xf69ace88    e59a0060               ldr r0, [thr, #+96]
        ;; Return:16(v0)
0xf69ace8c    e24bd000               sub sp, fp, #0
0xf69ace90    e8bd8800               ldmia sp!, {fp, pc}
0xf69ace94    e1200070               bkpt #0x0
}
What is printed here is slightly different from a snapshot built in product but the important part is that we can see the IR instructions alongside assembly.
Breaking it down:
#lint dartvm-dasm
        ;; Enter frame
0xf6a6ce60    e92d4800               stmdb sp!, {fp, lr}
0xf6a6ce64    e28db000               add fp, sp, #0
This is a standard function prologue, the frame pointer of the caller and link register are pushed to the stack after which the frame pointer is set to the bottom of the function stack frame.
As with the standard ARM ABI, this uses a full-descending stack meaning it grows backwards in memory.
#lint dartvm-dasm
        ;; CheckStackOverflow:8(stack=0, loop=0)
0xf6a6ce68    e59ac024               ldr ip, [thr, #+36]
0xf6a6ce6c    e15d000c               cmp sp, ip
0xf6a6ce70    9bfffffe               blls +0 ; 0xf6a6ce70
This is a simple routine which does what you probably guessed, checks if the stack overflowed.
Sadly their disassembler does not annotate either thread fields or branch targets so you have to do some digging.
A list of field offsets can be found in vm/compiler/runtime_offsets_extracted.h, which defines Thread_stack_limit_offset = 36 telling us that the field accessed is the threads stack limit.
After the stack pointer is compared, it calls the stackOverflowStubWithoutFpuRegsStub stub if it has overflowed. The branch target in the disassembly appears to be un-patched but we can still inspect the binary afterwards to confirm.
#lint dartvm-dasm
        ;; PushArgument(v3)
0xf6a6ce74    e285ca01               add ip, pp, #4096
0xf6a6ce78    e59ccfa7               ldr ip, [ip, #+4007]
0xf6a6ce7c    e52dc004               str ip, [sp, #-4]!
Here an object from the object pool is pushed onto the stack. Since the offset is too big to fit in an ldr offset encoding it uses an extra add instruction.
This object is in fact our "Hello, World!" string as a RawOneByteString* stored in the globalObjectPool of our isolate at offset 8103.
You may have noticed that offsets are misaligned, this is because object pointers are tagged with kHeapObjectTag from vm/pointer_tagging.h, in this case all of the pointers to RawObjects in compiled code are offset by 1.
#lint dartvm-dasm
        ;; StaticCall:12( print<0> v3)
0xf6a6ce80    ebfffffe               bl +0 ; 0xf6a6ce80
0xf6a6ce84    e28dd004               add sp, sp, #4
Here print is called followed by the string argument being popped from the stack.
Like before the branch hasn't been resolved, it is a relative branch to the entry point for print in dart:core.
#lint dartvm-dasm
        ;; ParallelMove r0 <- C
0xf69ace88    e59a0060               ldr r0, [thr, #+96]
Null is loaded into the return register, 96 being the offset to the null object field in a Thread.
#lint dartvm-dasm
        ;; Return:16(v0)
0xf69ace8c    e24bd000               sub sp, fp, #0
0xf69ace90    e8bd8800               ldmia sp!, {fp, pc}
0xf69ace94    e1200070               bkpt #0x0
And finally the function epilogue, the stack frame is restored along with any callee-saved registers. Since lr was pushed last, popping it into pc will cause the function to return.
From now on I'll be using snippets from my own disassembler which has less problems than the builtin one.
